
 I am a visual learner. And I know many of my students are visual learners or they benefit from extra visuals in our lessons. When I can see something in picture form, I can remember it better. This is one reason why I make anchor charts for math lessons.
I enjoy making anchor charts with my students because it can be a good way to review a topic. When you make them interactive, they can be a really engaging activity for students. Plus, students can go back and reference them anytime they need it.
When it comes to making math anchor charts, I have time and money saving tricks to help this learning tool be productive in your classroom. So let’s get into it on all the tips when it comes to making anchor charts for math strategies.
Anchor Charts for Math
Set up a place to display math anchor charts.
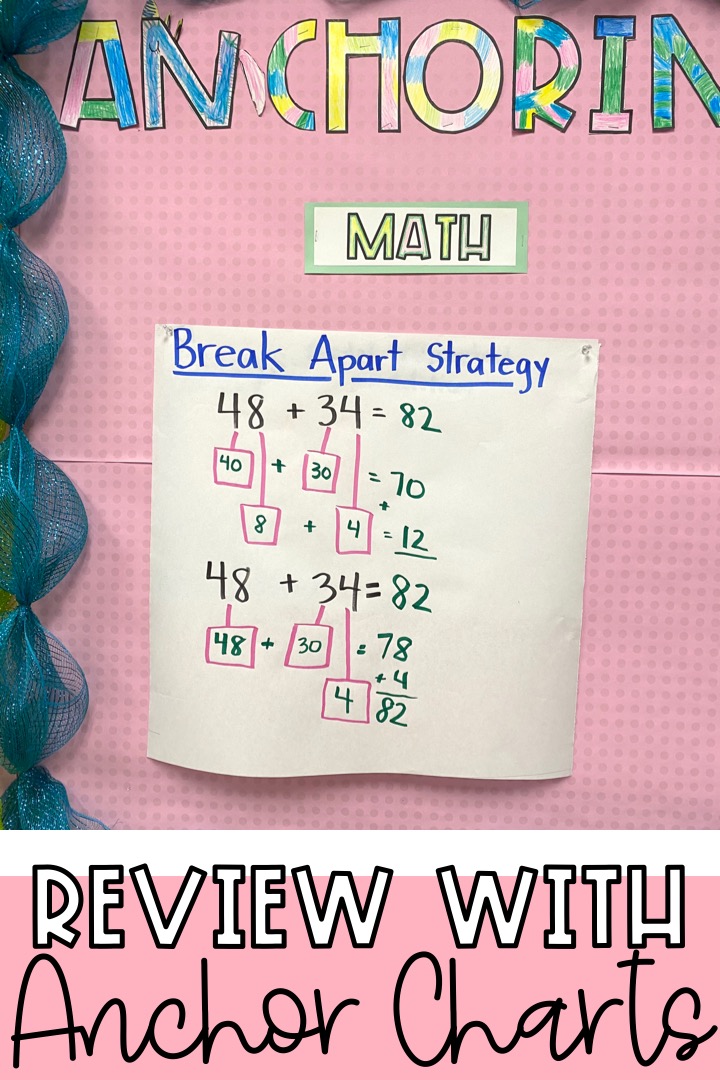
For my classroom, I have a bulletin board where I display all my anchor charts. I have a spot for my math anchor charts, reading anchor charts, and a category for my other anchor charts throughout the year.
I actually get my students involved in helping make this bulletin board at the beginning of the school year. The color the letters to “anchoring our learning.”
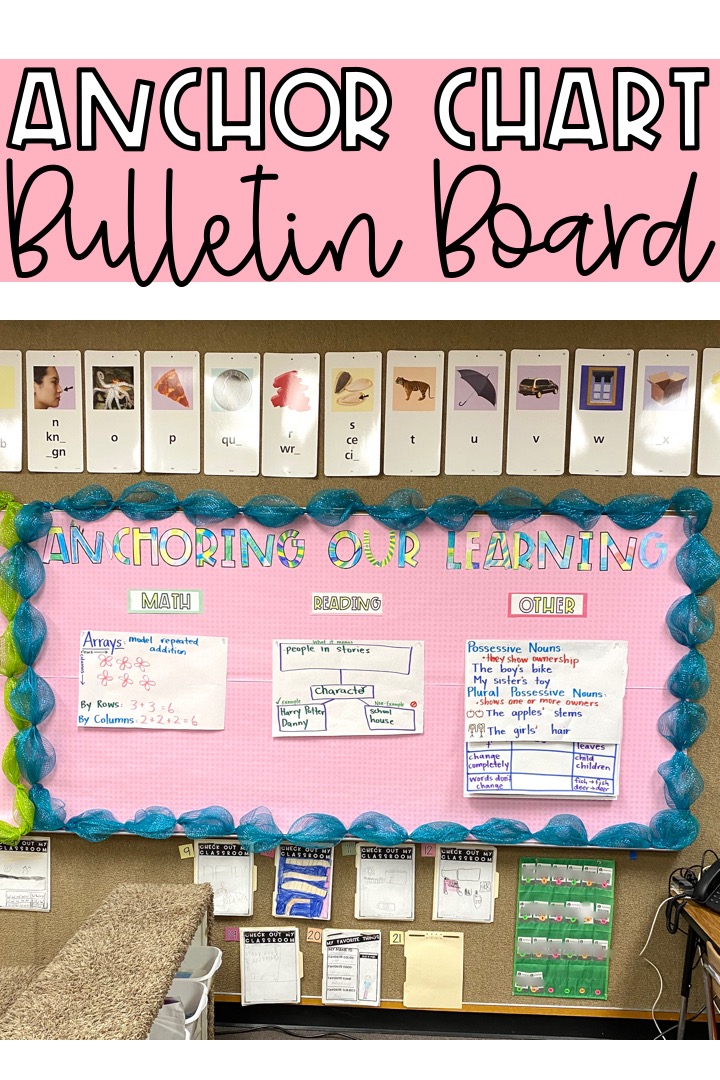
Once I am finished making an anchor chart with my students, I go hang it up on our bulletin board. Students know to refer to it if they need help on a subject. They can even flip the pages up and review older content if needed.
Find this Anchor Chart Bulletin Board resource here.
Make Anchor Charts with your Students.
I know it is tempting to make the anchor chart extra cute and make them before or after school when you have more time. But the thing is… Students are more likely to use the anchor chart if you make it with them.
I like to have an outline of how I want it to look. Then I ask students questions as I draw it. You can even outline it in pencil beforehand if you want.
Make Math Anchor Charts Interactive
As you are making your anchor chart with your students, make it interactive. One easy way to do this is to give students sticky notes.
For example, If we make an anchor chart on odd or even numbers, I would give each student a stick note. Students write an odd or even number and then place it on the correct spot on the anchor chart.
Making anchor charts interactive really helps sell students on them and gets them engaged in their learning.
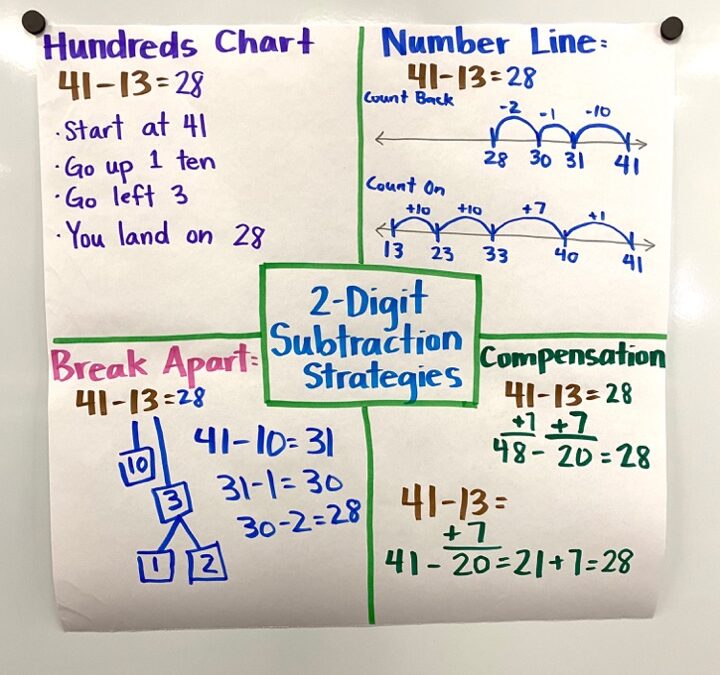
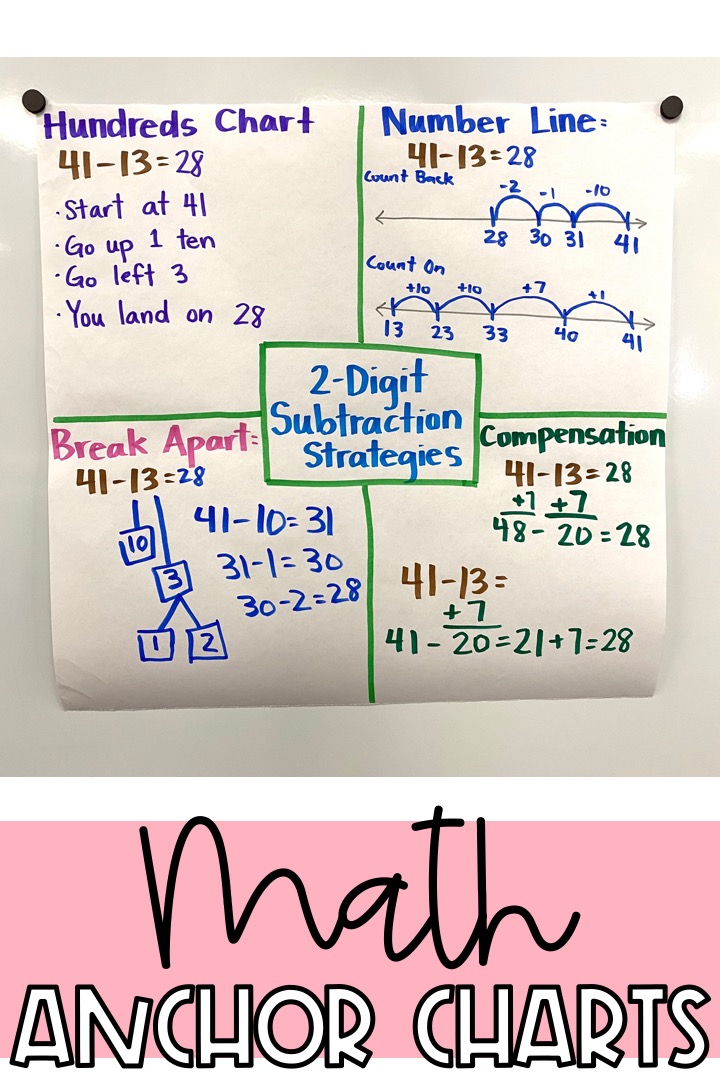
Use Math Anchor Charts as a Way to Review
I always have a little math meeting before our new math lesson. During this time I can review important concepts with my students.
How I like to review the math concept from the day before is making a math anchor chart. The students have already learned the concept so they can easily answer questions and help me make the chart.
This also allows me to see what holes my students may have and what I need to reteach.
Printable Math Anchor Charts
Now sometimes it is nice to have printable math anchor charts. These I find really helpful for when there are a lot of strategies for a math concept. For example, math fact strategies. I can display them in my classroom all year long.
When students are stuck on a math fact, I can point up to our math fact strategies anchor charts and ask students what strategy they want to use to solve the problem.
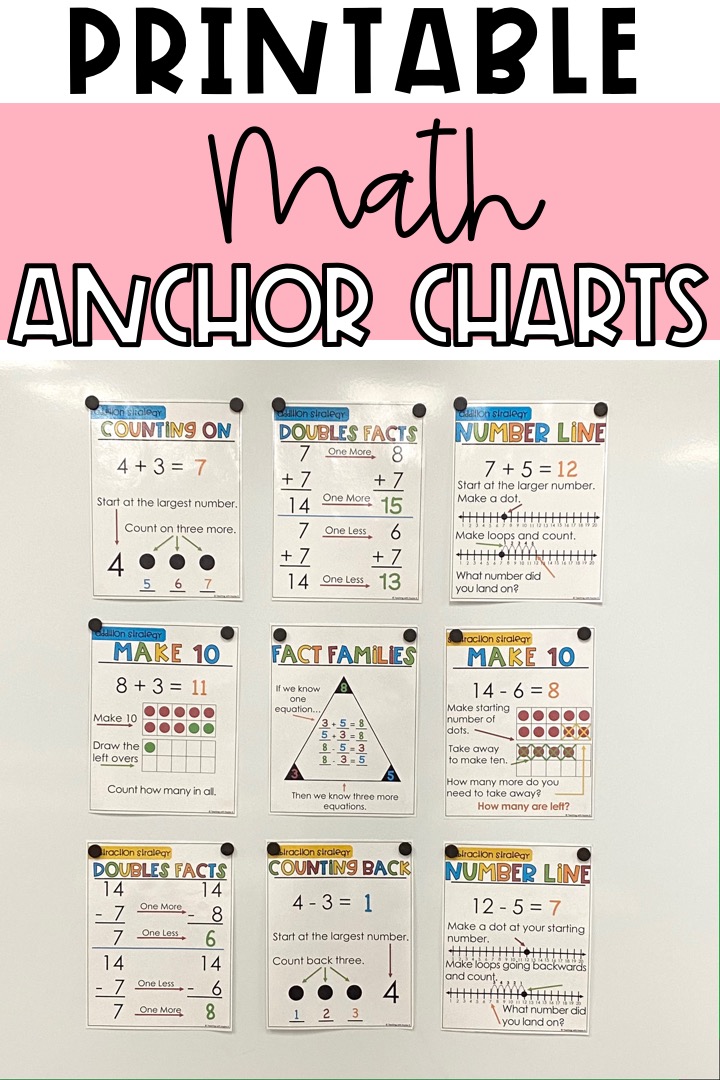
Find all printable math anchor charts I use for Math Fact Strategies in this bundle here.
To learn more about the math fact strategies I teach in my classroom read this blog post: Math Fact Strategies that Work
Even though math facts are only a small part of the math we teach all year it really is a foundational piece to math. Many students struggle to become fluent with addition and subtraction math facts.
After doing much research I have found 7 things teachers can do to ensure math fact fluency. Learn about each one of them here in my free workbook for 1st and 2nd grade teachers: The 7 Steps to Ensure Math Fact Fluency.
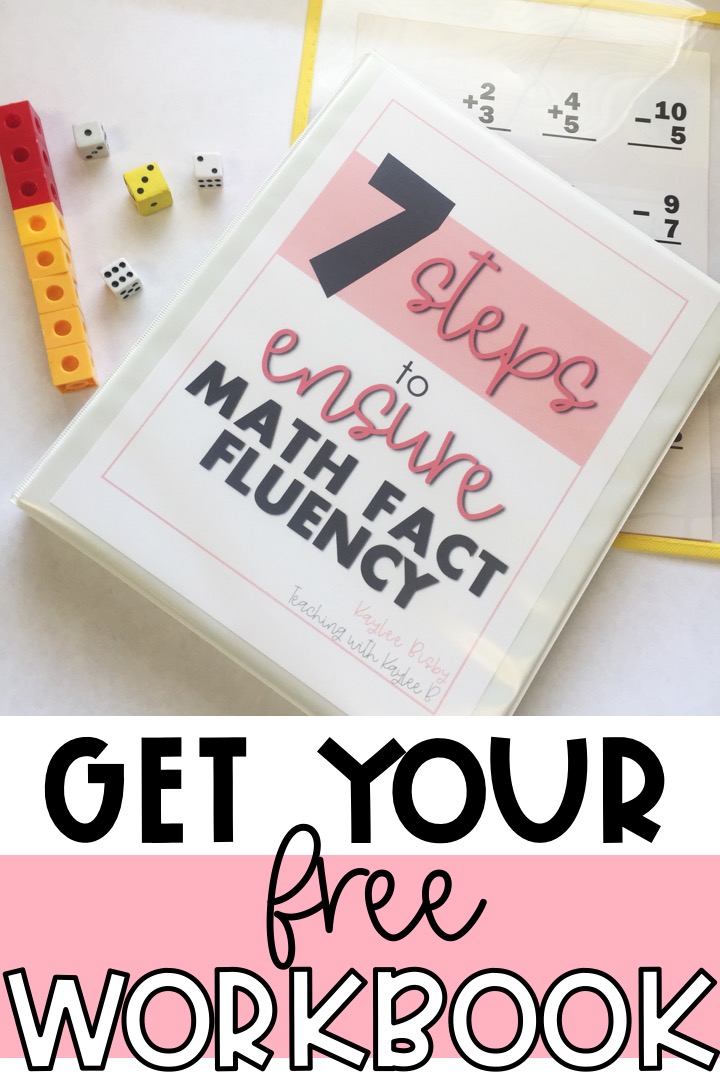
Download it here.